Join the discussion
Question 1/49
Using the dataset, plot a Map showing all the countries, filtered by Market to only include LATAM. Which country in the LATAM Market has the highest shipping delay (sum of total number of days between the order date and the ship date)?
Correct Answer: D
Explanation
VERY IMPORTANT QUESTION FOR THE EXAM, PAY ATTENTION
1) To find the number of days between order date and shipping date, we will make use of a calculated field:
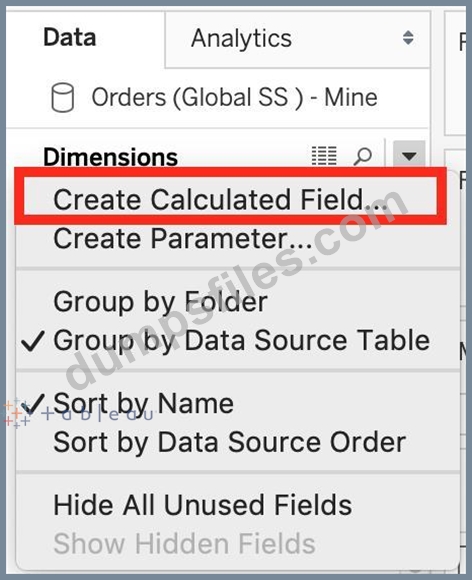
In the data pane, click on the dropdown arrow, and choose create calculated field.
Let's name this calculated field "ShippingDelay" (you can name it anything you want :) )
2) Use the DATEDIFF() function, and pass it the arguments as follows:
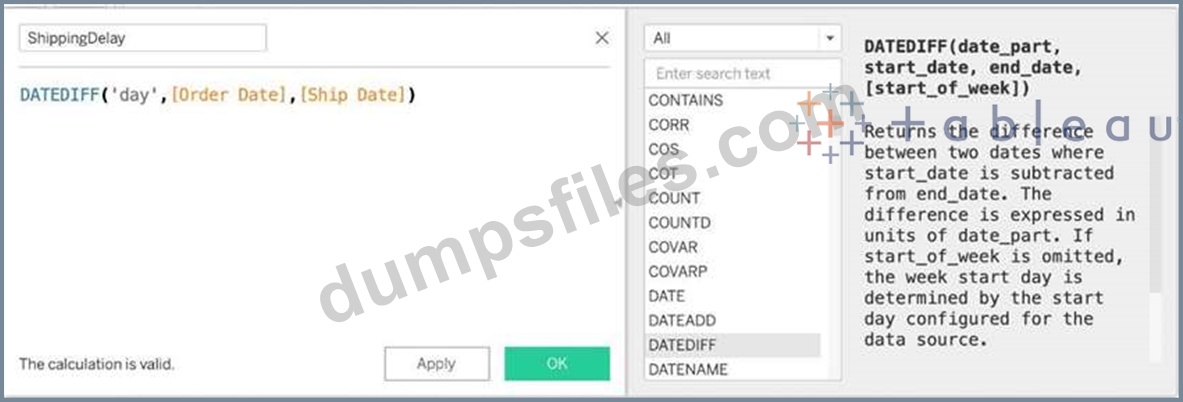
'day' depicts that we want to calculate the number of DAYS between the two dates. The first argument is
'start_date' which is the ORDER_DATE (day the order was placed), the second argument is 'end_date', which is the SHIP_DATE (date the order was shipped). So by subtracting as follows: SHIP_DATE - ORDER_DATE, we can find the delay in shipping.
Click OK.
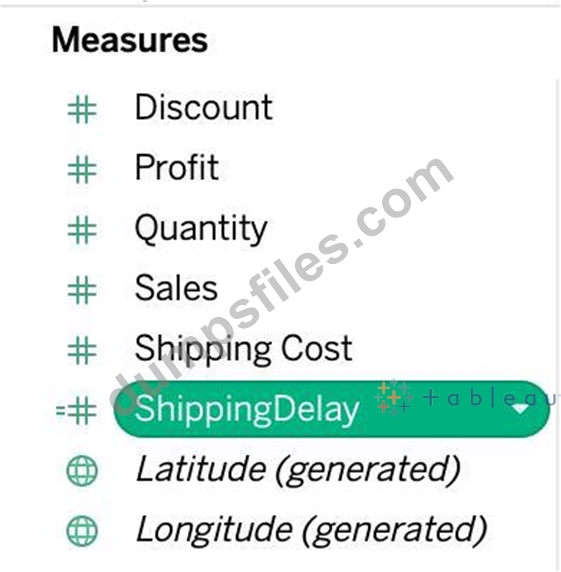
3) You should now have a new measure as follows:
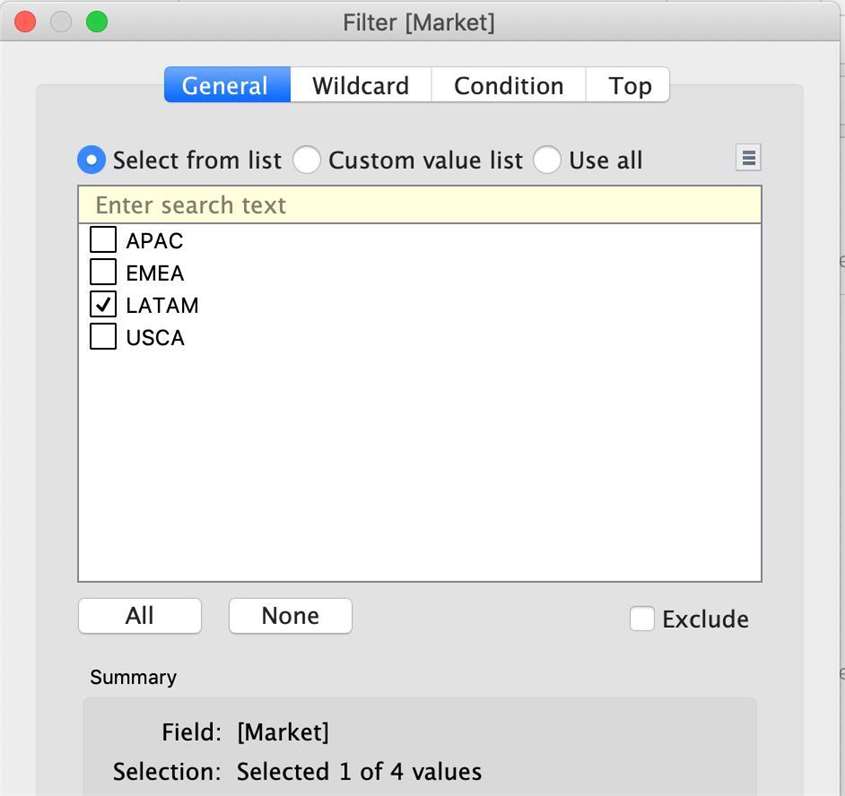
4) Phew! The hard part is done! Now let's filter by Market to include only LATAM:
5) Drag Country to the view, and the new calculated field 'ShippingDelay' to SIZE on the Marks Shelf as follows:
*You can also click on Show Text Labels to be sure that you're choosing the Largest value*
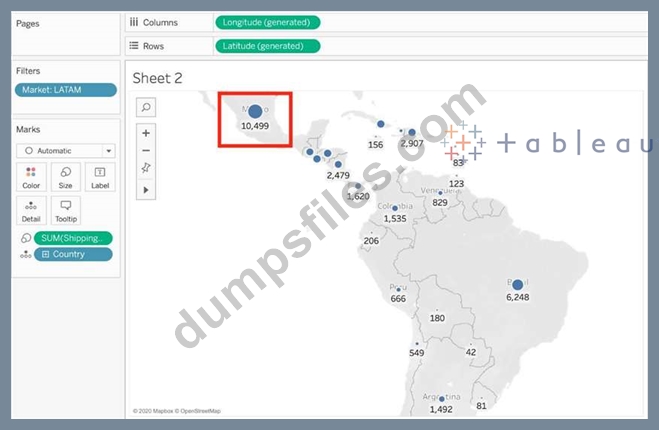
Clearly, Mexico has the highest Shipping Delay!
VERY IMPORTANT QUESTION FOR THE EXAM, PAY ATTENTION
1) To find the number of days between order date and shipping date, we will make use of a calculated field:
In the data pane, click on the dropdown arrow, and choose create calculated field.
Let's name this calculated field "ShippingDelay" (you can name it anything you want :) )
2) Use the DATEDIFF() function, and pass it the arguments as follows:
'day' depicts that we want to calculate the number of DAYS between the two dates. The first argument is
'start_date' which is the ORDER_DATE (day the order was placed), the second argument is 'end_date', which is the SHIP_DATE (date the order was shipped). So by subtracting as follows: SHIP_DATE - ORDER_DATE, we can find the delay in shipping.
Click OK.
3) You should now have a new measure as follows:
4) Phew! The hard part is done! Now let's filter by Market to include only LATAM:
5) Drag Country to the view, and the new calculated field 'ShippingDelay' to SIZE on the Marks Shelf as follows:
*You can also click on Show Text Labels to be sure that you're choosing the Largest value*
Clearly, Mexico has the highest Shipping Delay!
Add Comments

- Other Question (49q)
- Q1. Using the dataset, plot a Map showing all the countries, filtered by Market to only includ...
- Q2. Which of the following is a compelling reason to export a sheet in Tableau to a PDF?...
- Q3. True or False: It is possible to change the Geographic Role of a dimension...
- Q4. You have cleaned a data source properly, created some calculated fields and renamed some c...
- Q5. Using the Geo Data table, create a Bar chart showing the In-Stock percentage for each Colo...
- Q6. Download the Dataset from: https://drive.google.com/file/d/12AYHfiPWkwBmvH0zbumOURgUX6Az00...
- Q7. Which of the following are interactive elements that can be added to a dashboard for users...
- Q8. When creating a dashboard for multiple devices, which of the following Device options are ...
- Q9. Which of the following are benefits of using Data Extracts in Tableau?...
- Q10. Using the cwurData table, create a cross-tab showing the number of Publications per Countr...
- Q11. A Tableau Support case can be opened in which of the following valid ways?...
- Q12. Which Sub-Category had the least Profit in the Office Supplies category?...
- Q13. How can you change the Default Aggregation for a measure in Tableau?...
- Q14. Which of these is NOT a type of Quick Filter available in Tableau?...
- Q15. Larger image (Exhibit) What is this view referred to as in Tableau?...
- Q16. Which of the following are valid ways to trigger actions for a Dashboard?...
- Q17. Using the Time Series table, create a cross-tab showing sales for each Assortment broken d...
- Q18. The View Data window displays as much of the data as possible by default, up to __________...
- Q19. To use a quick table calculation, which of the following programming languages do you need...
- Q20. Using the Time-series table, create a cross tab showing the Sales for each Item Number-ID,...
- Q21. Is it possible to make a Measure discrete?
- Q22. Which of the following is NOT a new feature introduced in Tableau 2020.1?...
- Q23. To connect Tableau to a CSV data source what type of connection should you use?...
- Q24. What does the following icon do in Tableau? Larger image...
- Q25. True or False: All rows from both tables are returned in an INNER JOIN...
- Q26. Yes or No: The number of marks will increase when you increase the number of Dimensions in...
- Q27. True or False: It is possible to add a field to more than one hierarchy...
- Q28. A field that shows average home values for the United States in 2016 is most likely :...
- Q29. Using the dataset provided, create a crosstab showing the Profit of each Region per Year, ...
- Q30. If you see the following Filter, then you're working with _______________________ Larger i...
- Q31. DOWNLOAD THE DATASET FROM - https://drive.google.com/file/d/1F8L_Rl5B9LAz8RDi-DdjWx3Iv-Sgz...
- Q32. True or False: We can disaggregate the data, to see all of the marks in the view at the mo...
- Q33. You can create _______________ for members in a dimension so that their labels appear diff...
- Q34. How can you format an axis as Bold in Tableau?...
- Q35. __________ is a technique in Tableau which will identify marks with similar characteristic...
- Q36. Which of the following 2 columns CANNOT be deleted in Tableau?...
- Q37. _________________ is useful when you need to change how the data source is configured on a...
- Q38. Which of the following is not a Trend Line Model?...
- Q39. Which of the following are valid reasons to use a Tableau Data Extract (.tde) over Live Co...
- Q40. In Tree maps, the size begins with the largest rectangle on the ________________ and the s...
- Q41. Which of the following are valid ways to show Mark Labels in the visualisation?...
- Q42. True or False : Bins can be created on dimensions...
- Q43. True or False: The Highlighting action can be disabled for the entire workbook....
- Q44. Which of the following are valid ways to copy a worksheet visualisation as an image?...
- Q45. Using the Time Series table, create a chart that shows the percent difference in Average I...
- Q46. How do you identify a continuous field in Tableau?...
- Q47. Which one of the following is a dimension?
- Q48. Using the CoffeeChain table, create a Dual Axis chart showing the Sales (Bar chart) and Pr...
- Q49. Are animations enabled by default in Tableau?

[×]
Download PDF File
Enter your email address to download Tableau.Desktop-Specialist.v2023-06-22.q49.pdf