Join the discussion
Question 1/25
You have the following dataset.
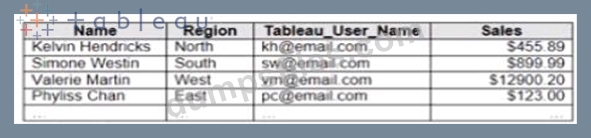
You plan to create a dashboard that will be filtered to show only data that is relevant to a specific Tableau user based on the Tableau_User_Name field You need to create a boolean calculated field to place on the data source finer Which formula should you use for the filter?
You plan to create a dashboard that will be filtered to show only data that is relevant to a specific Tableau user based on the Tableau_User_Name field You need to create a boolean calculated field to place on the data source finer Which formula should you use for the filter?
Correct Answer: D
Add Comments

- Other Question (25q)
- Q1. You have the following dataset. (Exhibit) You plan to create a dashboard that will be filt...
- Q2. You have a data source that contains data tor every city in the Unites States. The followi...
- Q3. You company has two divisions located in the United States and Germany Bach division has a...
- Q4. A colleague provides you with access to a folder that contains the following files: * Sate...
- Q5. You have a dataset that contains daily sales by business segment from 2017 to the present ...
- Q6. You plan to create a visualization that has a dual axis chart. The dual axis chart will co...
- Q7. You publish a dashboard tut uses an attract. The extract refreshes every Monday at 10:00. ...
- Q8. Open the Link to Book1 found on the desktop. Open Map worksheet and use Superstore data so...
- Q9. Open the link to Book1 found on the desktop. Use the Superstore data source. Split the Cus...
- Q10. Open the link to Book1 found on the desktop. Open the sales dashboard. Add the Sales by St...
- Q11. You have the following two datasets: * A Microsoft Excel worksheet that has two columns na...
- Q12. You have the following dashboard that contains two visualizations. (Exhibit) You want to s...
- Q13. Open the link to Book1 found on the desktop. Open Disciplines worksheet. Filter the table ...
- Q14. Open the Link to Book1 found on the desktop. Open Map worksheet and use Superstore data so...
- Q15. You have the Mowing dashboard. (Exhibit) Which two elements are floating? Choose two....
- Q16. in which three formats can you export a worksheet from the Worksheet menu? Choose three...
- Q17. You have the following line chart that shows the average sales by month. (Exhibit) Which m...
- Q18. You have the following tiled dashboard that has one sheet. (Exhibit) You want to replace f...
- Q19. You create a parameter named Choose Region fiat contains values from a field named Region....
- Q20. You have the following chart that shows the cumulative of sales from various dates. (Exhib...
- Q21. You have the following chart that shows profits and discounts over time. (Exhibit) You nee...
- Q22. You want to add a comment to March 2020 as shown in the following visualization. You have ...
- Q23. You company has two divisions located in the United States and Germany Bach division has a...
- Q24. You have the following dataset. (Exhibit) Which grouping option should you use m Tableau P...
- Q25. You have the following visualization. (Exhibit)...
