Join the discussion
Question 1/50
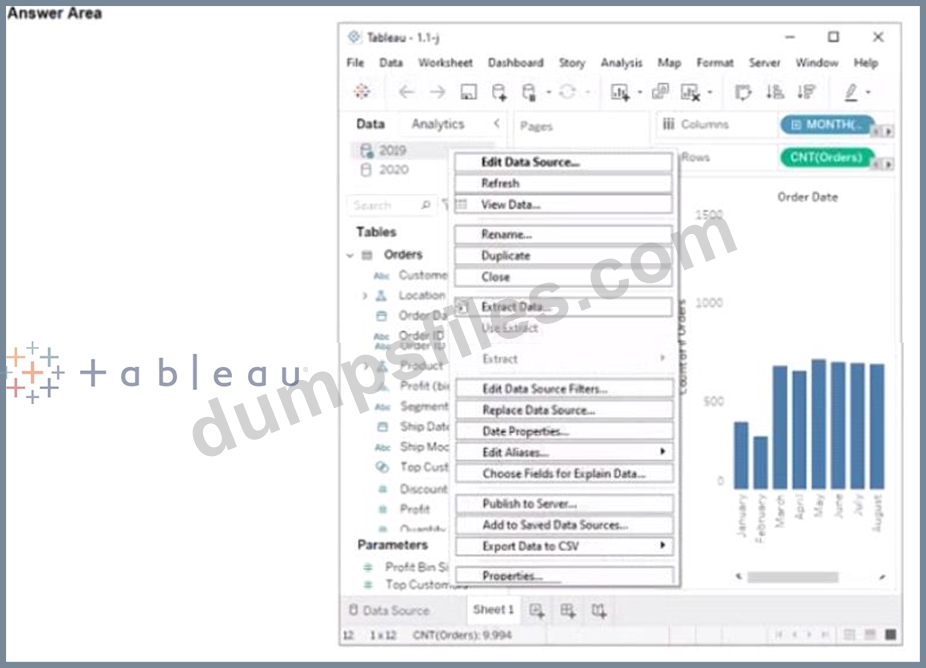
You have two data sources that use the same schema One data source contains order data from 2019 and the other data source contains order data from 2020.
You have a worksheet that shows the orders from 2019.
You need to configure the worksheet to show the orders from 2020 without reloading the data.
Which option should you select?
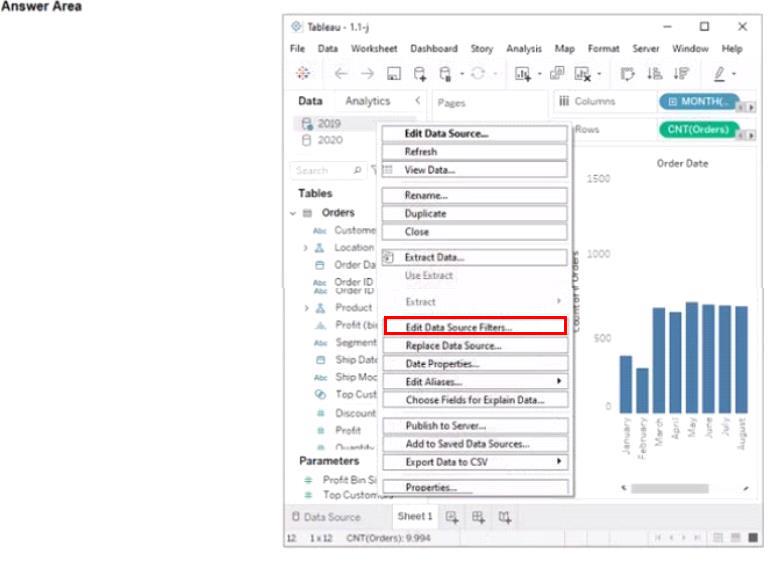
You have a worksheet that shows the orders from 2019.
You need to configure the worksheet to show the orders from 2020 without reloading the data.
Which option should you select?
Correct Answer:
Add Comments

- Other Question (50q)
- Q1. You have two data sources that use the same schema One data source contains order data fro...
- Q2. You want to add a comment to March 2020 as shown in the following visualization. You have ...
- Q3. You have the following data source in tableau Server. (Exhibit) You need to ensure that th...
- Q4. Open the link to Book1 found on the desktop. Open the sales dashboard. Add the Sales by St...
- Q5. You want to connect a Tableau workbook to a dataset in a Microsoft Excel spreadsheet. What...
- Q6. You have the following dataset. (Exhibit) You plan to create a dashboard that will be filt...
- Q7. in which throe formats can you export a worksheet from the Worksheet menu? Choose three...
- Q8. You have a database that includes field named sales, City and Region. You have the followi...
- Q9. Open the link to Book1 found on the desktop. Open the Histogram worksheet and use the Supe...
- Q10. You have the following two datasets: * A Microsoft Excel worksheet that has two columns na...
- Q11. Open the link to Book1 found on the desktop. Open the Movie Durations worksheet. Replace t...
- Q12. Open the link to Book1 found on the desktop. Use the Superstore data source. Split the Cus...
- Q13. You have a dataset that contains sates dat a. The following is a sample of the data. (Exhi...
- Q14. You have a dataset that contains daily sales by business segment from 2017 to the present ...
- Q15. You have the following bar chart. (Exhibit) You want the chart to appear as shown in the M...
- Q16. You have a dataset that has four fields named Category. Profit Sates and Customer Name. Yo...
- Q17. Open the link to Book1 found on the desktop. Open Disciplines worksheet. Filter the table ...
- Q18. A colleague provides you with access to a folder that contains the following files: * Sate...
- Q19. You have the following dataset. (Exhibit) You need to create the following worksheet. (Exh...
- Q20. You have the following chart that shows profits and discounts over time. (Exhibit) You nee...
- Q21. You company has two divisions located in the United States and Germany Bach division has a...
- Q22. A colleague provides you with access to a folder that contains the following files: * Sate...
- Q23. You need to change the values of a dimension without creating a new field. What should you...
- Q24. You have the following dataset that contain null values in the Profits field. (Exhibit) Yo...
- Q25. You have the following tiled dashboard that has one sheet. (Exhibit) You want to replace f...
- Q26. You need to change the values of a dimension without creating a new field. What should you...
- Q27. Open the Link to Book1 found on the desktop. Open Map worksheet and use Superstore data so...
- Q28. You have a line chart on a worksheet. You want to add a comment to March 2020 as shown in ...
- Q29. You have a dataset that contains daily sales by business segment from 2017 to the present ...
- Q30. Open the link to Book1 found on the desktop. Open the Movie Durations worksheet. Replace t...
- Q31. Open the link to Book1 found on the desktop. Open the Histogram worksheet and use the Supe...
- Q32. You have the following two datasets: * A Microsoft Excel worksheet that has two columns na...
- Q33. You have a dataset that contains people and the awards they have won. (Exhibit) Which form...
- Q34. You have the following visualization. (Exhibit) The Last() calculation is set to compute u...
- Q35. You have the following dashboard. (Exhibit) When a user selects a only on the map the data...
- Q36. You have the following dashboard. (Exhibit) When a user selects a only on the map the data...
- Q37. You have the following line chart that shows the average sales by month. (Exhibit) Which m...
- Q38. You have the following line chart that shows the average sales by month. (Exhibit) Which m...
- Q39. Open the link to Book1 found on the desktop. Open the Movie Durations worksheet. Replace t...
- Q40. You conned to a Microsoft SQL Server database You need to create a custom SQL query that r...
- Q41. Open the link to Book1 found on the desktop. Open the CategoryPercentage worksheet. Modify...
- Q42. You want to add a draft watermark to a dashboard as shown in the following exhibit. (Exhib...
- Q43. Open the link to Book1 found on the desktop. Open Disciplines worksheet. Filter the table ...
- Q44. You have the following dataset. (Exhibit) Which Level of Detail (LOD) expression should yo...
- Q45. You have a dataset that contains daily sales by business segment from 2017 to the present ...
- Q46. Open the Link to Book1 found on the desktop. Open Map worksheet and use Superstore data so...
- Q47. You want to add a comment to March 2020 as shown in the following visualization. You have ...
- Q48. You company has two divisions located in the United States and Germany Bach division has a...
- Q49. Open the link to Book1 found on the desktop. Open SalesVSProfit worksheet. Add a distribut...
- Q50. You plan to create a visualization that has a dual axis chart. The dual axis chart will co...
