Join the discussion
Question 1/121
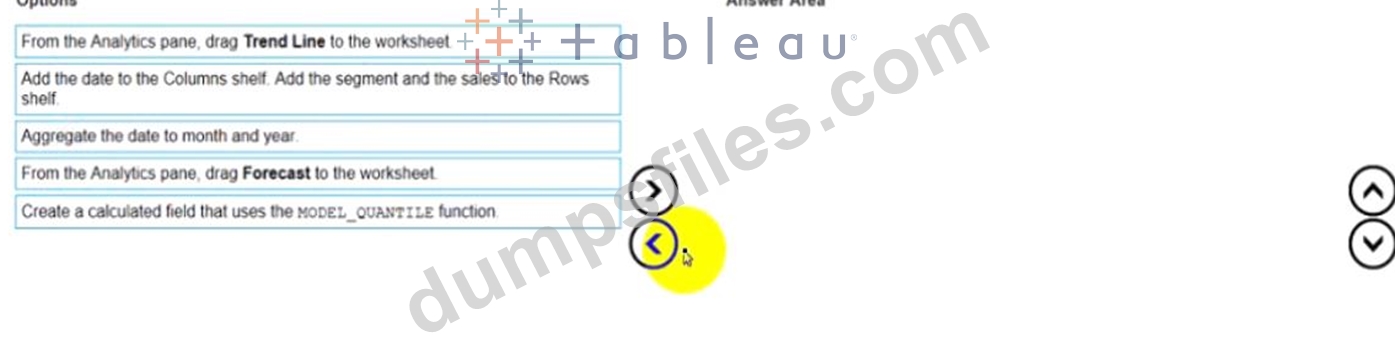
You have a dataset that contains daily sales by business segment from 2017 to the present You want to use monthly historical trends to predict sales by segment in the future Which three actions should you perform m order?
(Place the three correct options in order Use the arrows to move Options lo Answer Area I In Answer Area arrows to re order the options.)
(Place the three correct options in order Use the arrows to move Options lo Answer Area I In Answer Area arrows to re order the options.)
Correct Answer:
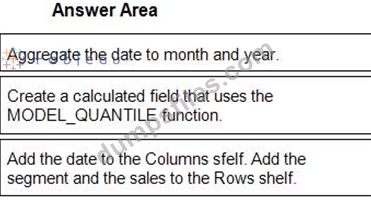
1 - Aggregate the date to month and year.
2 - Create a calculated field that uses the MODEL_QUANTILE function.
3 - Add the date to the Columns sfelf. Add the segment and the sales to the Rows shelf.
Add Comments

- Other Question (121q)
- Q1. You have a dataset that contains daily sales by business segment from 2017 to the present ...
- Q2. You have a table that contains four columns named Order Date, Country, Sales, and Profit. ...
- Q3. You have the following dataset: (Exhibit) You want to create a parameter to dynamically fi...
- Q4. You have a dataset that contains daily sales by business segment from 2017 to the present ...
- Q5. You have the following dashboard. (Exhibit) When a user selects a only on the map the data...
- Q6. Open the link to Book1 found on the desktop. Open Disciplines worksheet. Filter the table ...
- Q7. You have the following view. (Exhibit) You want to filter the view lo show only records th...
- Q8. In a worksheet, you have a calculated column named YTD Sales that uses the following formu...
- Q9. You have the following calculated fields in a worksheet. [Calc1] = DATEADD ('year', -1, TO...
- Q10. You have the following dataset. (Exhibit) You want to create a new calculated dimension fi...
- Q11. You have the following tiled dashboard that has one sheet. (Exhibit) You want to replace t...
- Q12. You have a data source that has two tables named Table1 and Table2. Table1 is the primary ...
- Q13. You have the following dashboard. (Exhibit) When a user selects a only on the map the data...
- Q14. You have a dashboard that contains a parameter named Start Date. You need to create an ext...
- Q15. You have a Tableau workbook. You want to make the workbook available in Tableau Online. Wh...
- Q16. Open the link to Book1 found on the desktop. Open the CategoryPercentage worksheet. Modify...
- Q17. You have the following dashboard that contains two visualizations. (Exhibit) You want to s...
- Q18. Open the link to Book1 found on the desktop. Open Disciplines worksheet. Filter the table ...
- Q19. You have the following dataset that contain null values in the Profits field. (Exhibit) Yo...
- Q20. Open the link to Book1 found on the desktop. Open the Histogram worksheet and use the Supe...
- Q21. You want to add a draft watermark to a dashboard as shown in the following exhibit. (Exhib...
- Q22. You have two data sources that use the same schema One data source contains order data fro...
- Q23. Open the link to Book1 found on the desktop. Use the Superstore data source. Split the Cus...
- Q24. You need to change the values of a dimension without creating a new field. What should you...
- Q25. You have the following visualization. (Exhibit)...
- Q26. Open the link to Book1 found on the desktop. Use the Superstore data source. Split the Cus...
- Q27. You are the owner of an alert. You receive an email notification that the alert was suspen...
- Q28. Open the link to Book1 found on the desktop. Open Disciplines worksheet. Filter the table ...
- Q29. You create a parameter named Choose Region fiat contains values from a field named Region....
- Q30. You have a data source that contains data tor every city in the Unites States. The followi...
- Q31. You have a line chart on a worksheet. You want to add a comment to March 2020 as shown in ...
- Q32. You have a table that contains the following data. (Exhibit) How should you complete the f...
- Q33. Open the link to Book1 found on the desktop. Open the Histogram worksheet and use the Supe...
- Q34. You have the following bar chart. (Exhibit) You want the chart to appear as shown in the M...
- Q35. You want to create the following table in a view. (Exhibit) Which function should you use ...
- Q36. You have the following dataset that contain null values in the Profits field. (Exhibit) Yo...
- Q37. You have the following dataset (Exhibit) You need to create the following visualization. (...
- Q38. You have the following dashboard that contains two visualizations. (Exhibit) You want to s...
- Q39. You have the following box plot that shows the distribution of average profits made in eve...
- Q40. You publish a dashboard tut uses an attract. The extract refreshes every Monday at 10:00. ...
- Q41. You have a dashboard than contains two sheets named Sheet 1 and Sheet 2. You want to add a...
- Q42. You have two tables named Employeelnfo and DepartmentInfo. Employeelnfo contains four fiel...
- Q43. You want to add a comment to March 2020 as shown in the following visualization. You have ...
- Q44. You have the following dataset. (Exhibit) When you use the dataset in a worksheet, you wan...
- Q45. You have a data source that has two tables named Table1 and Table2. Table1 is the primary ...
- Q46. You want to add a draft watermark to a dashboard as shown in the following exhibit. (Exhib...
- Q47. You have a data source that contains the following columns. (Exhibit) You have the followi...
- Q48. You have the following primary data source that contains a dimension named Dorm_Code. (Exh...
- Q49. You plan to create a visualization that has a dual axis chart. The dual axis chart will co...
- Q50. Open the link to Book1 found on the desktop. Open the CategoryPercentage worksheet. Modify...
- Q51. You company has two divisions located in the United States and Germany Bach division has a...
- Q52. You have the following tiled dashboard that has one sheet. (Exhibit) You want to replace f...
- Q53. You have a table that contains the following data. (Exhibit) How should you complete the f...
- Q54. You have a dataset that has four fields named Category. Profit Sates and Customer Name. Yo...
- Q55. You have the following dashboard that contains two sheets. (Exhibit) You want to minimize ...
- Q56. You have the following chart that sorts states by the number of products each state has pu...
- Q57. Open the link to Book1 found on the desktop. Open SalesVSProfit worksheet. Add a distribut...
- Q58. You have the following two tables. (Exhibit) Table A is the primary table. Which type of j...
- Q59. You have a large data source that contains more than 10 million rows. Users can filter the...
- Q60. You need to change the values of a dimension without creating a new field. What should you...
- Q61. You have the following visualization. (Exhibit) You Create a table calculation named Rank_...
- Q62. You want to create the following dashboard that will contain two sheets. (Exhibit) What sh...
- Q63. You want to create the following dashboard. (Exhibit) The dashboard will contain two sheet...
- Q64. You have the following visualization. (Exhibit)...
- Q65. You have a data source that contains the following columns. (Exhibit) You want to sort cus...
- Q66. You create a parameter named Choose Region fiat contains values from a field named Region....
- Q67. You have the following map. (Exhibit) You need the map to appear as shown in the following...
- Q68. You have two data sources that use the same schema One data source contains order data fro...
- Q69. Open the link to Book1 found on the desktop. Open SalesVSProfit worksheet. Add a distribut...
- Q70. You have a Tableau Prep flow that joins a dataset named Global Indicators to a dataset nam...
- Q71. You have the following bar chart. (Exhibit) You want the chart to appear as shown in the M...
- Q72. You want to create the following table in a view. (Exhibit) Which function should you use ...
- Q73. You publish a dashboard that uses an extract. The extract refreshes every Monday at 10:00....
- Q74. You have the following dataset. (Exhibit) You need to generate the results in the Day fiel...
- Q75. You have a dataset that contains sates dat a. The following is a sample of the data. (Exhi...
- Q76. You are creating an annual report in Microsoft Word. In Tableau Desktop, you build a chart...
- Q77. Open the link to Book1 found on the desktop. Open SalesVSProfit worksheet. Add a distribut...
- Q78. You have the following dataset. (Exhibit) You need to create the following worksheet. (Exh...
- Q79. You have the following line chart that shows the average sales by month. (Exhibit) Which m...
- Q80. You have a Tableau workbook that contain three worksheets named Sheet1 Sheet2 and Sheet3. ...
- Q81. You have a data set that contains three columns named Sales, Profit, and Quantity. You nee...
- Q82. Open the Link to Book1 found on the desktop. Open Map worksheet and use Superstore data so...
- Q83. You plan to create a visualization that has a dual axis chart. The dual axis chart will co...
- Q84. Open the Link to Book1 found on the desktop. Open Map worksheet and use Superstore data so...
- Q85. You have a Tableau Prep flow that joins a dataset named Global Indicators to a dataset nam...
- Q86. You receive a tab-delimited data file name sales.tsv. You need to connect to the file. Whi...
- Q87. You are the owner of an alert. You receive an email notification that the alert was suspen...
- Q88. You have the following two datasets: * A Microsoft Excel worksheet that has two columns na...
- Q89. You have two data sources that use the same schema One data source contains order data fro...
- Q90. You have the following dataset: (Exhibit) Which grouping option should you use in Tableau ...
- Q91. You have a sales dataset that contains the following fields. (Exhibit) You need to analyze...
- Q92. You have a dataset that contains sates dat a. The following is a sample of the data. (Exhi...
- Q93. You create the following worksheet (Exhibit) The Pick Measure parameter contains the follo...
- Q94. You use a quick table calculation lo calculate the moving average of a measure named Sales...
- Q95. You need to change the values of a dimension without creating a new field. What should you...
- Q96. You have the following dataset. (Exhibit) You want to create a new calculated dimension fi...
- Q97. Open the link to Book1 found on the desktop. Open the sales dashboard. Add the Sales by St...
- Q98. You have the following dataset. (Exhibit) You plan to create a dashboard that will be filt...
- Q99. Open the link to Book1 found on the desktop. Open the Movie Durations worksheet. Replace t...
- Q100. You company has two divisions located in the United States and Germany Bach division has a...
- Q101. Open the Link to Book1 found on the desktop. Open Map worksheet and use Superstore data so...
- Q102. A colleague provides you with access to a folder that contains the following files: * Sate...
- Q103. You have the following dashboard that contains two sheets. (Exhibit) You want to minimize ...
- Q104. You have the following chart that shows the cumulative of sales from various dates. (Exhib...
- Q105. You have a database that includes field named sales, City and Region. You have the followi...
- Q106. You have a dataset that has four fields named Category. Profit Sates and Customer Name. Yo...
- Q107. You have the following dashboard that contains two visualizations. (Exhibit) You want to s...
- Q108. You have two tables named Employeelnfo and DepartmentInfo. Employeelnfo contains four fiel...
- Q109. You have a workbook that connects to a database. The database requires authentication. You...
- Q110. You have the Mowing dashboard. (Exhibit) Which two elements are floating? Choose two....
- Q111. You have the following dataset. (Exhibit) Yon need to calculate the ranking shown in the R...
- Q112. You have a dashboard that contains confidential information about patients health. The dat...
- Q113. You have a data source that contains the following columns. (Exhibit) You want to filter r...
- Q114. You have the following chart that shows the cumulative of sales from various dates. (Exhib...
- Q115. You have a dataset that contains people and the awards they have won. (Exhibit) Which form...
- Q116. You have the following chart that shows profits and discounts over time. (Exhibit) You nee...
- Q117. in which throe formats can you export a worksheet from the Worksheet menu? Choose three...
- Q118. Open the link to Book1 found on the desktop. Use the Superstore data source. Split the Cus...
- Q119. You have the following tiled dashboard that has one sheet. (Exhibit) You want to replace f...
- Q120. You have a data source that contains 20 tables. You want the tables to be organized within...
- Q121. You conned to a Microsoft SQL Server database You need to create a custom SQL query that r...
